Amateur ExtraE5C11
Which point in Figure E5-1 best represents the impedance of a series circuit consisting of a 300-ohm resistor and an 18-microhenry inductor at 3.505 MHz?
B
Answer
Electrical principles and calculations
Type
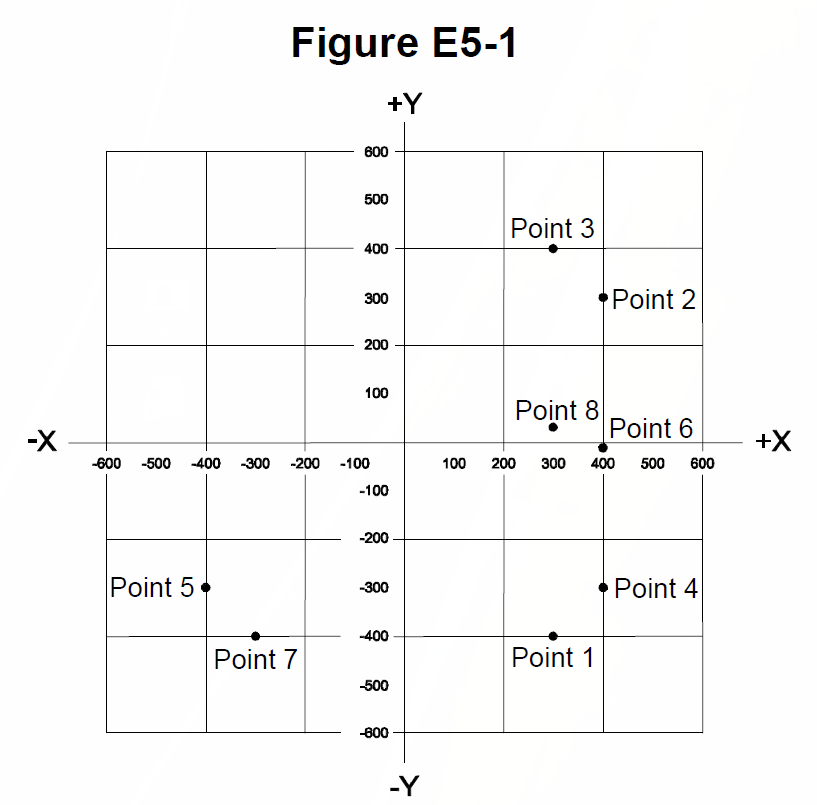
A
Point 1
B
Point 3
C
Point 7
D
Point 8
Answer Notes
To find the correct point on the Smith chart, you must first calculate the inductive reactance using the formula X_L = 2πfL. Plugging in a frequency of 3.505 MHz and an inductance of 18 microhenrys yields a reactance of approximately 396 ohms.
In complex impedance terms, this is written as 300 + j396 ohms, because inductive reactance is always positive. On a Smith chart, the horizontal axis represents pure resistance, while the curves stretching upward represent positive (inductive) reactance.
Looking at Figure E5-1, Point 3 is located on the right side of the chart along the 300-ohm resistance circle and in the upper half, intersecting the +400-ohm reactance arc. This perfectly matches the calculated impedance of the series circuit.
Previous · E5C10
Which point on Figure E5-1 best represents the impedance of a series circuit consisting of a 400-ohm resistor and a 38-picofarad capacitor at 14 MHz?
Next · E5C12
Which point on Figure E5-1 best represents the impedance of a series circuit consisting of a 300-ohm resistor and a 19-picofarad capacitor at 21.200 MHz?