Amateur ExtraE5C12
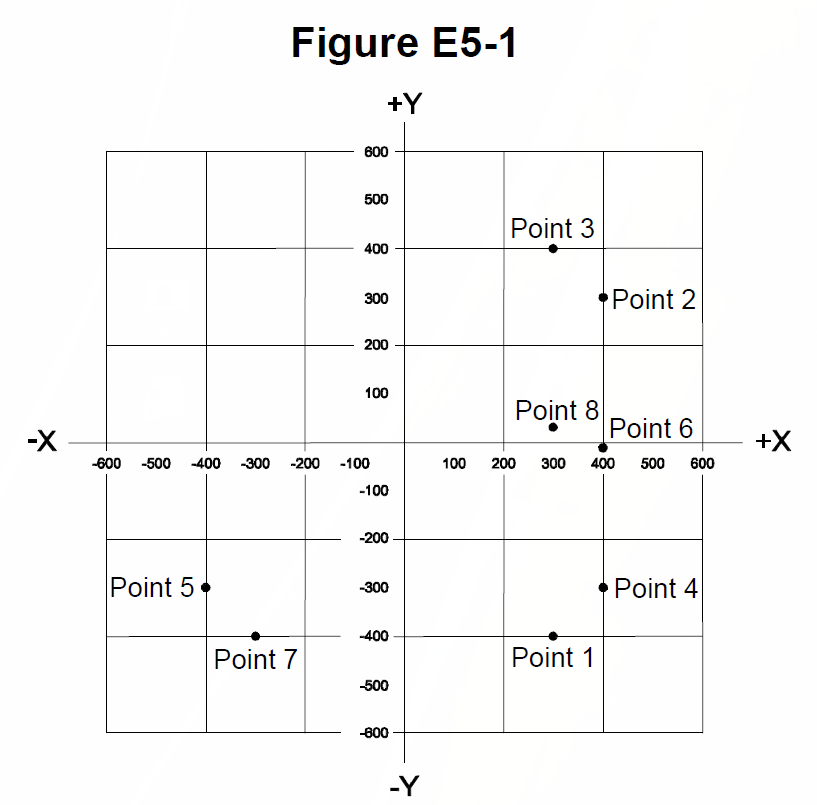
Which point on Figure E5-1 best represents the impedance of a series circuit consisting of a 300-ohm resistor and a 19-picofarad capacitor at 21.200 MHz?
A
Answer
Electrical principles and calculations
Type
A
Point 1
B
Point 3
C
Point 7
D
Point 8
Answer Notes
The first step is to calculate the capacitive reactance using the formula X_C = 1 / (2πfC). When you plug in 21.200 MHz for the frequency and 19 picofarads for the capacitance, the resulting reactance is approximately 395 ohms.
Because capacitors introduce negative reactance, the complex impedance of this circuit is expressed as 300 - j395 ohms. On a Smith chart, pure resistance is found on the horizontal center line, while the bottom half of the chart is used to plot negative (capacitive) reactance.
Examining Figure E5-1, Point 1 sits on the 300-ohm resistance circle and drops down into the bottom half of the chart, aligning closely with the -400-ohm reactance curve. This correctly represents the calculated impedance of your resistor and capacitor series circuit.
Previous · E5C11
Which point in Figure E5-1 best represents the impedance of a series circuit consisting of a 300-ohm resistor and an 18-microhenry inductor at 3.505 MHz?
Next · E5D01
What is the result of conductor skin effect?